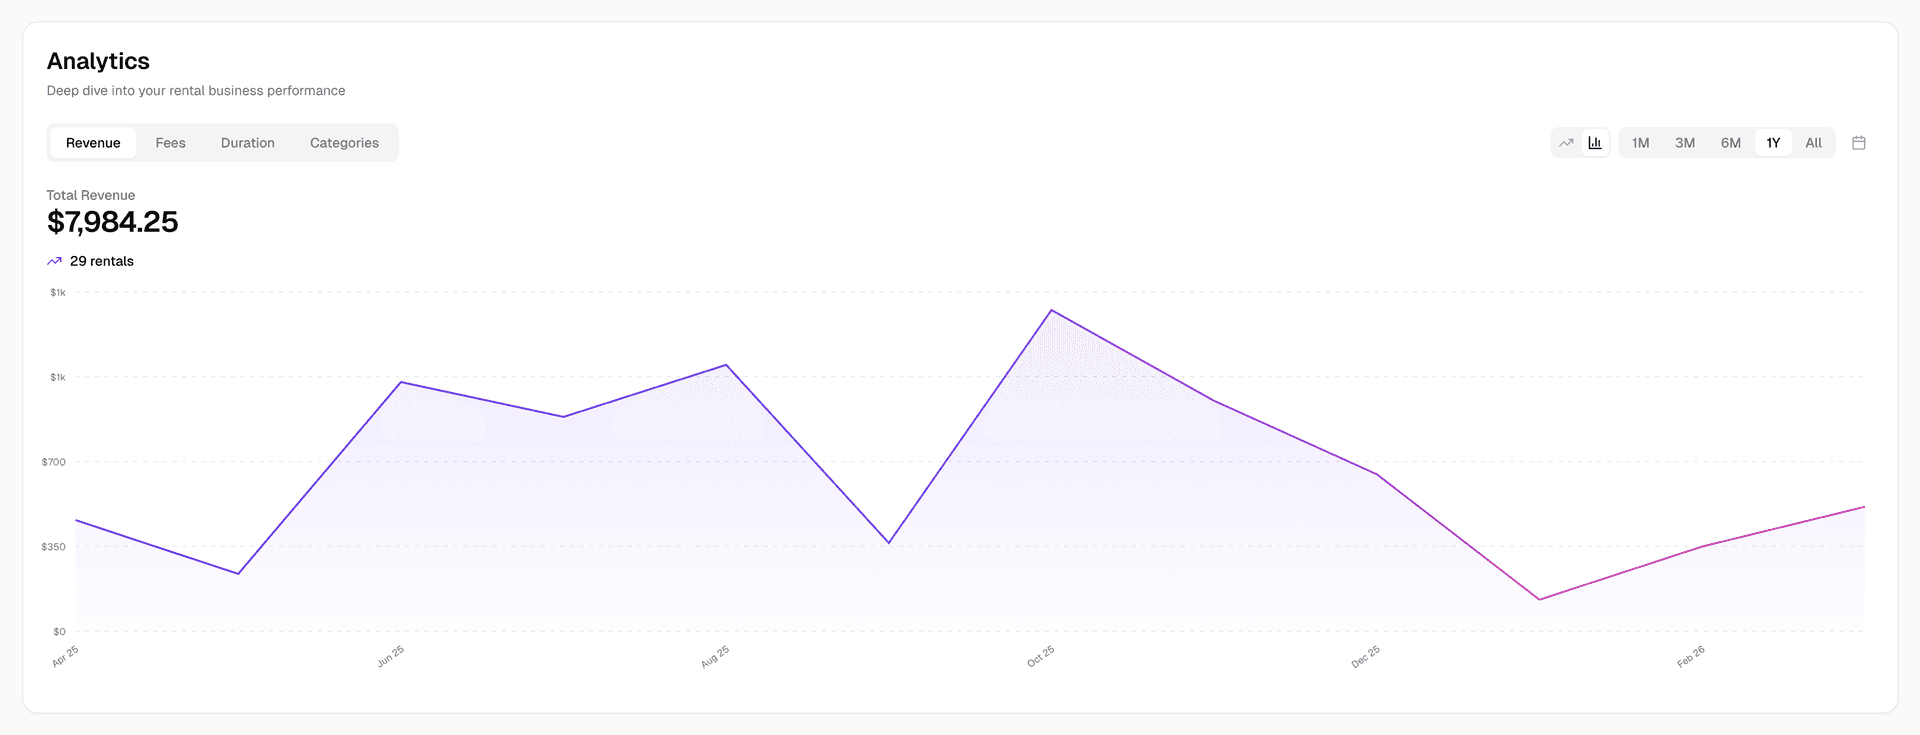
See your earnings at a glance
Rental IQ gives you a clear view of monthly revenue trends, totals, and growth so you always know how your rental business is performing.
Revenue is scattered across months of emails and spreadsheets
You know roughly what you earn per month, but getting an accurate number means digging through Sharegrid payout emails, bank statements, and half-updated spreadsheets.
Without a revenue dashboard, you cannot see trends. Is this month better than last month? Is this year tracking ahead of last year? You are flying blind on the numbers that matter most.
Rental IQ aggregates all your rental income into one dashboard, updated automatically as you import transactions.
How it works
Import your rental data
Upload a Sharegrid CSV export or connect your email to pull in transaction history. Off-platform rentals are included too.
Revenue is calculated automatically
Rental IQ breaks down your earnings by month, showing net revenue after fees and discounts. Totals update as new transactions come in.
Track trends over time
See month-over-month and year-over-year comparisons. Spot seasonal patterns and growth trends without building a spreadsheet.
Break down by equipment or category
See which items or categories generate the most revenue. Identify your top earners and understand where your income is concentrated.
What makes this different
Net revenue, not gross
Sharegrid fees, discounts, and promos are automatically subtracted. You see what you actually earned, not the headline number.
All sources combined
Sharegrid bookings, email-enriched transactions, and off-platform rentals all feed into the same revenue view. One number, one truth.
Trend visualization
Monthly bar charts and growth indicators make it easy to see whether your business is growing, flat, or declining at a glance.
Equipment-level detail
Drill from total revenue down to individual items. See exactly how much each piece of gear contributed in any time period.
Who it's for
Solo owner-operators
If you rent casually, the revenue dashboard shows you whether the effort is worth it and how your earnings change season to season.
High-volume renters
With dozens of rentals per month, you need a single place to see total revenue, growth rate, and which gear drives the most income. The dashboard gives you that without spreadsheet work.
Rental houses
For rental houses, the revenue dashboard is your top-line reporting tool. See total revenue, track month-over-month performance, and share numbers with your team.
Related features
Ready to track your rental business?
Free during beta. No credit card required. Import your data and start seeing results in minutes.